


Fixing Citrix WEM High CPU Usage

While troubleshooting an issue with Cisco AMP in our Citrix environment I was noticing that the Citrix.Wem.Agent.Service executable was consistently using 10-15% CPU utilization on each of my CVAD servers (Win2016, Non-Persistent). I would see the CPU consumption consistently run in this range then briefly drop to 0% and then back up again. I confirmed my suspicion by looking at the App Trends report in ControlUp Insights and filtering to the WEM Agent service. Looking back over the past 6 months you can see that the process incrementally starts to consume more resources.

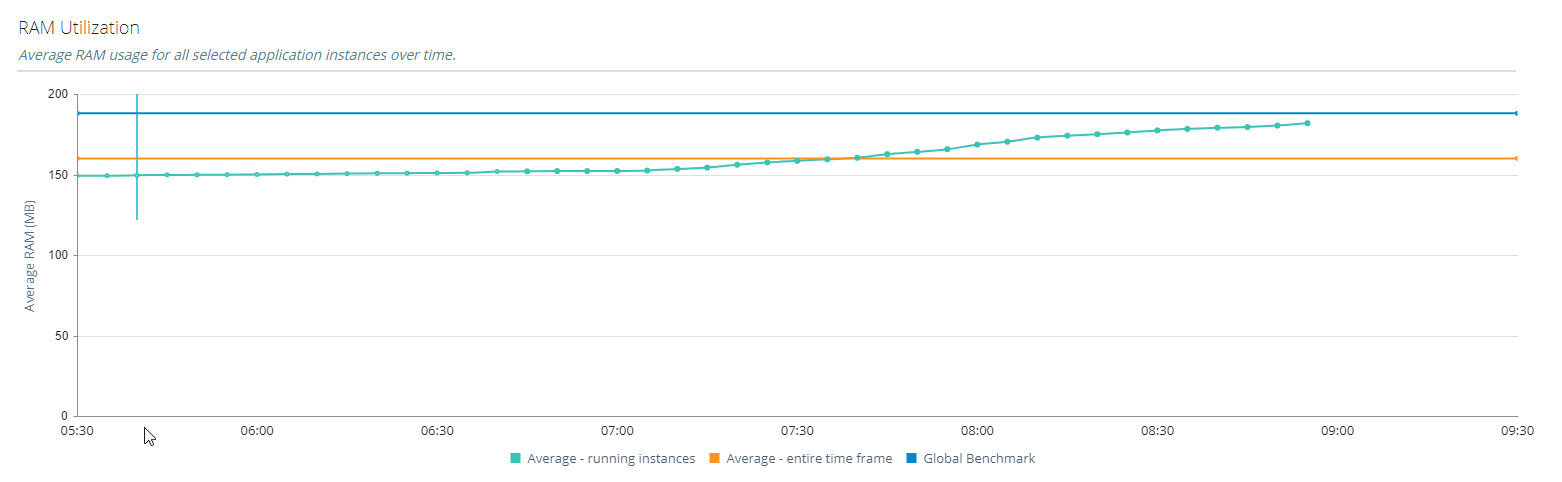
The chart above is showing CPU Utilization across the entire environment. It’s not just CPU though, the below charts show that memory and disk I/O increased as well.

What tipped me off to possibly being an issue with the cache is I noticed that some recently built machines that were added to the machine catalog recently were not exhibiting this behavior. Furthermore, on inspection of the cache files located on the MCS cache disk (D:\Cache\WEM in my environment) I saw that the LocalAgentDatabase.db file on the machines exhibiting the high resource utilization was anywhere between 500-700kb while the same file was around 100kb on the machines without this issue.
Now, I’ve dealt with plenty of WEM issues at a previous employer in a much larger environment and knew from previous experience that you can safely restart the WEM Agent Service while users are logged in without interrupting their work. In this case I was going to have to “troubleshoot in production”. The caveat here is you don’t want to do this while someone is possibly logging in. So the best way to do this is to put the affected server in maintenance mode first before you do this and then remove it from maintenance mode when you are done. I stopped the Citrix WEM Agent Service (which also stops the NetLogon service) deleted the LocalAgentDatabase.db and LocalAgentCache.db files. I then started the NetLogon and Citrix WEM Agent Service back up. Within about 5 secs the two db files that I deleted were recreated and rebuilt. After about 10 secs, their files sizes stopped growing so it was clear that had finished rebuilding. I confirmed that doing this stopped the high CPU utilization on the server. Ok, great, I have a fix but how do I do this on hundreds of servers? I could script in it PowerShell-only (actually I had a script that would do this from a previous employer but its not generalized and specific to that environment so I can’t share unfortunately) or I could use PowerShell and ControlUp Script actions. If you haven’t used ControlUp’s scripted actions before, you should try it. There are a lot of great community scripts out there that will help Citrix Engineers troubleshoot every day issues. I actually originally created this ControlUp scripted action for a different purpose but its works in this scenario as well.
You will need to update one thing in this script. On line 21&22, update the values for the WEM cache location to what it is in your environment.
You can find the script here
Create a new script based action in ControlUp. Ensure the settings and arguments as are follows:
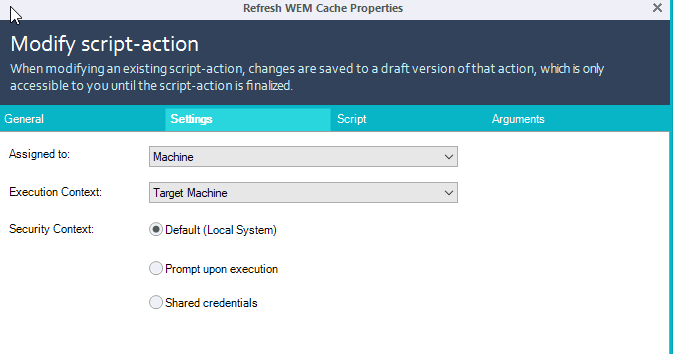

Once in your ControlUp console you can select your servers, right-click, Script Actions, then select your WEM cache script.

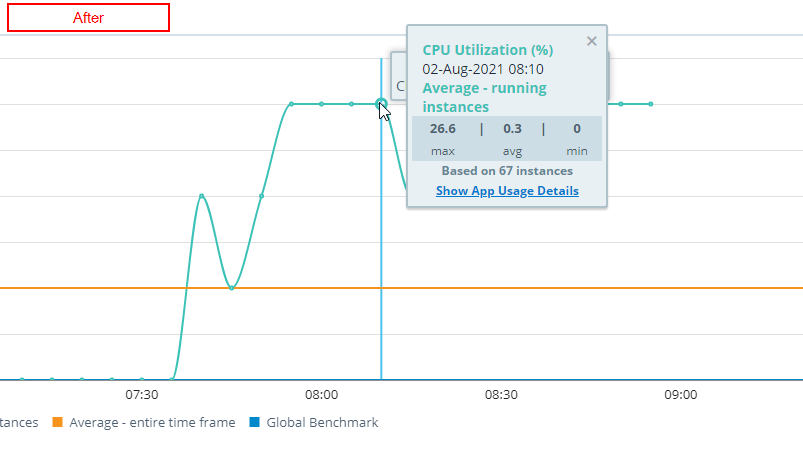
After the cache files had been rebuilt on all the servers the change was obvious in the data. I took the past 4 hours data in Insights and compared with the same timeframe from the previous week.
CPU - Before

CPU - After
RAM - Before

RAM - After
I/O - Before
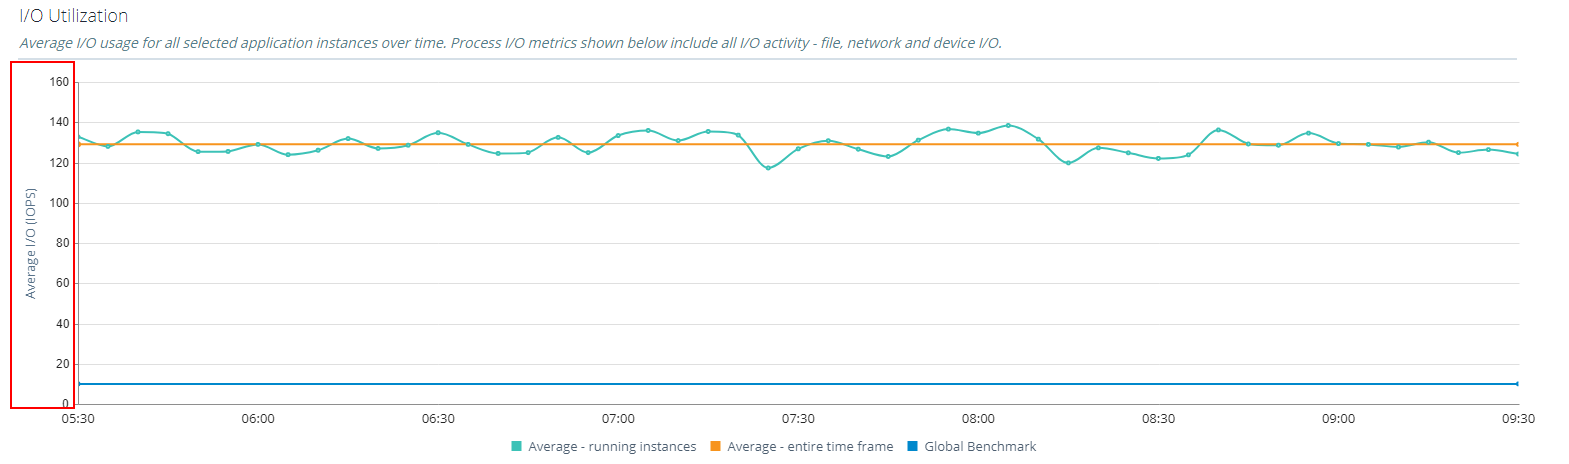
I/O - After

Pretty substantial impact on all metrics. The million dollar question? Why is this happening? I don’t know, I have a case open with Citrix to try understand what is going on here. WEM is supposed to help save resources, not consume them. It’s very possible its something in my WEM configuration. If I hear back, I’ll update this article.
I hope this helps someone.